Vison atmospheric toolbox : Ch4 concentration
The Atmospheric Toolbox aims to provide scientists with tools for ingesting, processing, and analyzing atmospheric remote sensing data. The toolbox consists of several software components, with the main components being CODA, HARP, VISAN, and QDOAS.
VISAN is a cross-platform visualization and analysis application for atmospheric data.In this activity, we will use VISAN.
Step1: Visan installation
1. install anaconda or miniconda
2. Create a new environment
Environment>create>choose name e.g myenvironment > inPackages>python3.7*

3. Open Terminal
Environment>myenvironment> open terminal

4. install visan:
- conda install -c conda-forge visan
![]()
- Press yes to proceed.
In this example, we are viewing CH4 concentration nc file from Sentinel-5P
Step3:
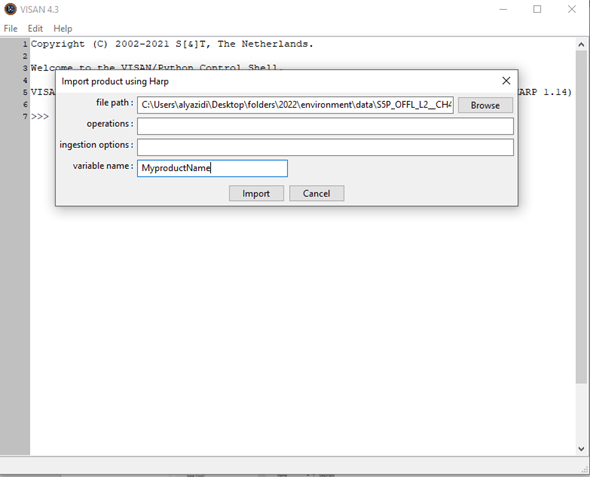
1. Harp import
- In visan
window>file>import harp

2. Choose directory
- Browse to
the directory where you downloaded the data and assign a name

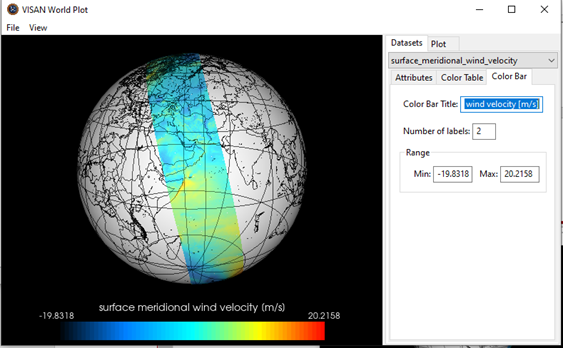
- wplot(MyproductName)

Choose image title, colour scale and range in the graphical window (VISAN World Plot)

